

Predicting Roblox popularity means using data like player counts, likes, dislikes, and ratings to figure out how many visits a game will get. Researchers built a machine learning model that correctly explains about 78% of why some Roblox games blow up while others don't.
The Quick Answer: What Actually Makes a Roblox Game Popular?
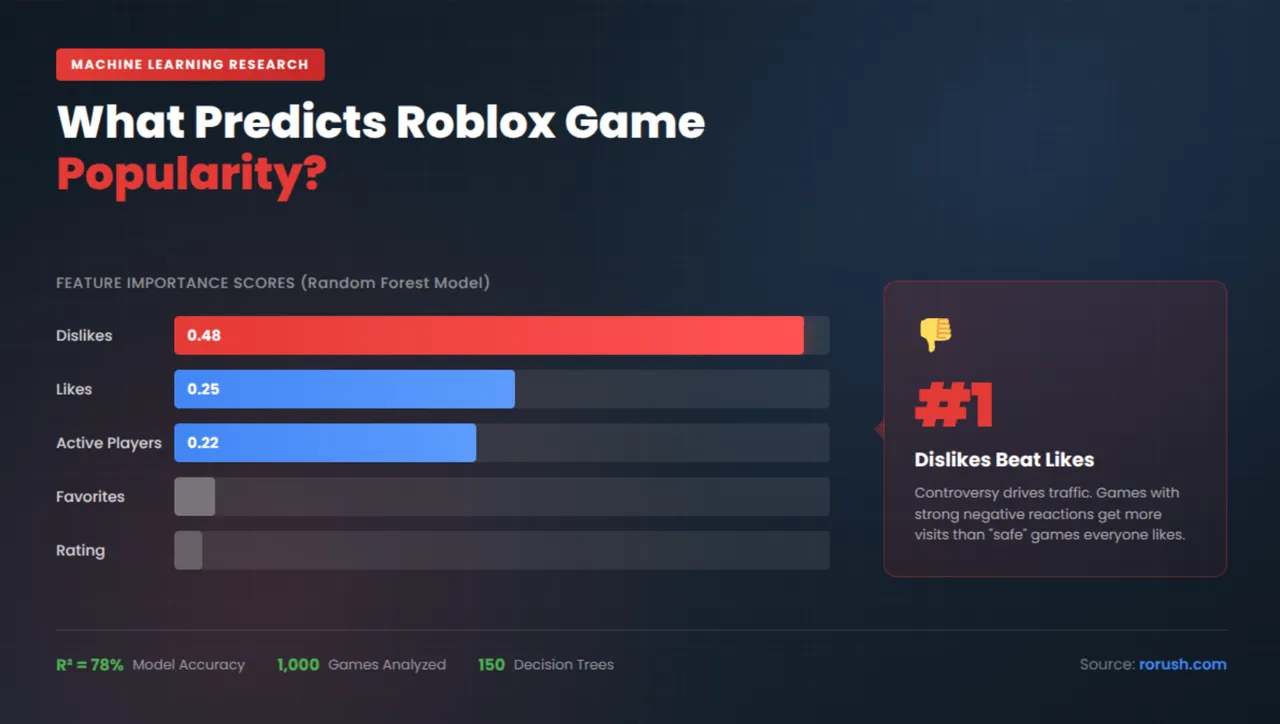
Here's the thing that surprised everyone: dislikes matter more than likes.
The Random Forest model found these importance scores:
| Feature | Importance Score |
|---|---|
| Dislikes | 0.48 |
| Likes | 0.25 |
| Active Players | 0.22 |
| Favorites | 0.03 |
| Rating | 0.02 |
So dislikes have almost twice the predictive power of likes. Why? Games that get lots of dislikes also tend to get lots of attention. They're controversial. They're talked about. And controversy drives traffic, even when it's negative.
The Dataset: 1,000 Top Roblox Games
The study pulled data from the top 1,000 games on Roblox. Each game had 8 columns of data:
- Rank (position in the top 1000)
- Name (game title)
- Active (current players online)
- Visits (total visits, this is what we're predicting)
- Favourites (how many people saved it)
- Likes
- Dislikes
- Rating (calculated from likes vs dislikes)
The top game, Blox Fruits, had 483,372 active players, 41.3 billion visits, 13.6 million favourites, and 8.5 million likes at the time of data collection.
How Random Forest Works (The Math)
Random Forest is basically a bunch of decision trees that vote on the answer. You train 150 different trees, each one looks at the data slightly differently, and then you average their predictions.
The Core Formula
The expected prediction for a new input X looks like this:

Where:
- A_n(X,Θ) is the terminal region (leaf node) containing X under randomization parameter Θ
- N_n(X,Θ) is the number of training samples falling within that region
- E_Θ is the expectation taken over all possible randomizations of tree structures
In plain English: the model finds all training games that landed in the same "bucket" as your new game, then averages their visit counts.
Why It Actually Works
The theoretical guarantee is that as your dataset grows infinitely large, the Random Forest estimator converges to the true regression function:

This means the predictions get closer and closer to reality as you feed more data into the model.
Building Each Tree
For each tree t in the forest:
- Draw a bootstrap sample D_t from the original dataset
- Construct a decision tree using randomized feature selection
- For each terminal node, calculate the local prediction:

- Aggregate all tree predictions to get the ensemble output:

The study used 150 trees with a maximum depth of 15, which balances accuracy against overfitting.
The Correlations That Matter
Before building the model, the researchers checked which features actually correlate with visits.
Strong positive correlations:
- Likes and Visits: 0.77
- Active Players and Visits: 0.75
- Dislikes and Visits: 0.81
Interesting negative correlation:
- Likes and Dislikes: -0.87
That last one makes sense. Games people love don't usually get hated. But here's the weird part: both likes AND dislikes correlate positively with visits. More feedback of any kind means more traffic.
Weak correlations:
- Rating and Visits: 0.04
- Rating and Likes: 0.18
Rating barely matters for predicting visits. A game with an 80% rating and a game with a 95% rating can have wildly different visit counts.
Model Performance Numbers
The model was trained on 800 games (80%) and tested on 200 games (20%).
R² Score: 0.7814
This means the model explains 78.14% of the variance in visit counts. That's pretty solid for predicting something as chaotic as game popularity.
Out of Bag Score: 0.5676
Random Forest has a built in validation trick. Each tree only sees about 63% of the data due to bootstrap sampling, so you can test each tree on the data it didn't see. The OOB score of 0.57 shows the model learned real patterns, not just memorized the training data.
Error Metrics:
- Mean Squared Error (MSE): 544,899,627,096,328,000
- Root Mean Squared Error (RMSE): 738,173,169
- Mean Absolute Error (MAE): 208,532,159
These numbers look massive because visits range from tens of thousands to billions. The MAE tells you that on average, predictions are off by about 208.5 million visits. For games with billions of visits, that's acceptable. For smaller games, the model struggles more.
Why Dislikes Beat Everything Else
This is the controversial finding. Dislikes had an importance score of 0.48, nearly double the next feature.
Think about it this way: games that attract enough attention to get lots of dislikes are games people actually played. They're games people have opinions about. And in the Roblox algorithm, engagement is engagement.
A game with 100,000 likes and 50,000 dislikes has way more momentum than a game with 10,000 likes and 200 dislikes. The first game is being talked about. The second is being ignored.
This doesn't mean you should try to make a bad game. But it does mean that playing it safe and making something nobody has strong feelings about is worse for visibility than making something polarizing.
The Distribution Problem
Most Roblox games are invisible. The data shows a heavily right skewed distribution:
- Mean active players: 5,736
- Standard deviation: 26,584
- Range: from a few hundred to 483,372
A few games dominate player engagement completely. The histogram shows most games clustered near zero, with a long tail stretching toward the outliers.
Same pattern for visits:
- Mean visits: 636 million
- Range: 28,198 to 55.6 billion
- Standard deviation: 2.9 billion
The top games have billions of visits. Most games have millions. The gap between "successful" and "mega successful" is enormous.
Limitations You Should Know About
The model struggles with extremes. Games with very high or very low visit counts get predicted less accurately. The scatter plot of actual vs predicted visits shows more spread at the tails.
The data is only publicly available metrics. Session duration, in game purchases, player retention rates, and other internal metrics weren't included. Roblox doesn't share those publicly, and they probably matter a lot.
Data sparsity for smaller games. The dataset only includes the top 1,000 games, so we don't know how well this model would work for predicting success of brand new games or games ranked 5,000th.
Correlation isn't causation. Dislikes correlate with visits, but getting more dislikes won't magically boost your visits. Popular games get both likes and dislikes because they're popular, not the other way around.
What Game Developers Should Actually Do
Based on the feature importance analysis:
- Focus on generating strong reactions. Neutral games get ignored. Games that make people feel something, even if some of that feeling is negative, get talked about.
- Active player count matters. It's the third most important feature. Games that can maintain concurrent players signal to the algorithm (and to potential new players) that something worth playing is happening.
- Don't obsess over your rating percentage. Rating had an importance score of 0.02. A 92% rated game doesn't automatically beat an 85% rated game in visits.
- Favourites don't drive traffic much. Importance score of 0.03. People favourite things and forget about them.
The Technical Setup
For anyone wanting to replicate this:
Python libraries used:
- pandas for data loading
- scikit learn for the Random Forest Regressor
- matplotlib for visualization
- joblib for model serialization
Model configuration:
- n_estimators = 150 (number of trees)
- max_depth = 15 (how deep each tree can grow)
- n_jobs = -1 (use all CPU cores)
- random_state = fixed seed for reproducibility
Data preprocessing steps:
- Remove non numeric characters (commas, hashtags) from numeric columns
- Convert strings to integers/floats
- Drop rows with missing values using dropna()
- Exclude Name and Rank columns from features (they don't predict anything useful)
Future Research Directions
The paper suggests several ways to build on this work:
- Add player behavior data like average session length and return rates
- Test other algorithms like Gradient Boosting or Neural Networks
- Include time series data to see how games grow over time instead of just snapshots
- Analyze genre effects to see if certain game types have different success patterns
The Bottom Line
You can predict Roblox game popularity with decent accuracy using publicly available metrics. The Random Forest model explains about 78% of why games succeed. And the biggest surprise is that negative feedback (dislikes) is the strongest predictor, probably because it indicates engagement rather than quality.
The math works. The model is reproducible. And the insight about dislikes challenges the assumption that you need to make everyone happy to succeed on Roblox.